
Current Ideas/Analysis.
Disclaimer: The information provided on this site is opinion, intended for informational purposes only, and does not constitute investment advice.
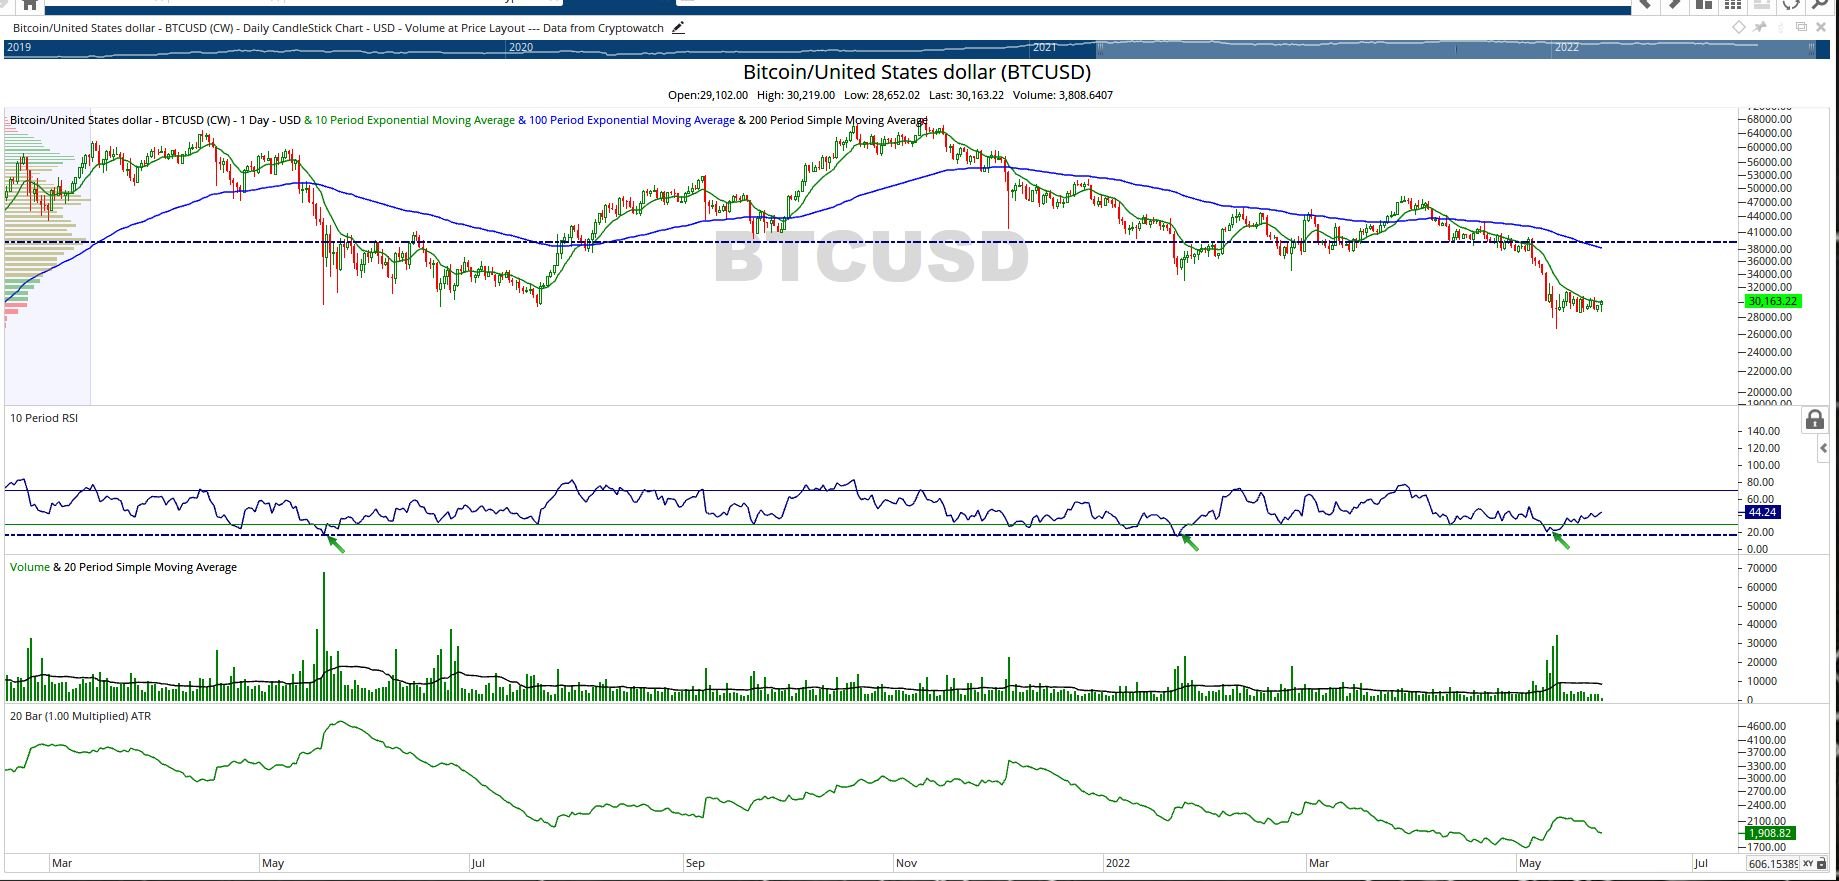
BTC/USD
Flash Synopsis 05/25/22: Adding to Current long
The Trade:
We’ve decided to add to our long BTC position at current levels ($30,211.02). While we’re not calling a bottom, or making a call for a significant move higher in the short term, we’re comfortable adding to our position at these prices. For full disclosure, we are long biased BTC and view it as one of our core holdings, meant to be accumulated over time.
Technical Look:
· BTC has traded in a fairly narrow range over the last 14 days (when looking at closing prices), ranging between $30K and $31K
· The most recent spike in volume on the 12th showed a range of $3,679 from high to low, but just $71 between open and close. Essentially we see this as a push and pull between bullish and bearish investors, that ultimately resulted in very little movement in price (despite the increase in volume)
· The recent uptick in momentum is bullish in our view (using the 10 period RSI as a proxy)
· Historically (indicated by green arrows in panel 2), we saw a 10 period RSI of 16.979 in May of 2021, and a mark of 15.076 on January 22, 2022. On May 9th we saw the RSI decline to 20.317, and expect that momentum will push higher from here. From our vantage point, the increase in momentum should coincide with an increase in BTC prices.
· The high volume node around $39K would be our short term price target, but in candor we expect that we will continue to trade flat for the foreseeable future.
**What concerns us**
· For starters, BTC volume has been below its 20 day moving average for the last 14 days or so. It’s difficult for us to acknowledge conviction (one way or the other) when trading volumes are this low.
· On chain analytics shows increased levels of BTC on exchanges over the last week, which we view as bearish.
· The ratio of the top 10 exchange inflows to total inflows (i.e. the Whale ratio), is also on the rise. In our view this implies that larger traders are moving their BTC on to exchanges in the event that they need to sell the asset. We expect that the size of these traders’ positions has the potential to have an outsized impact on price movement.
· Funding rates remain negative, which implies stronger selling pressure (and potential lower prices), in our view.
Ultimately this trade is much more about accumulation of the asset than a call on short term price movement. We like the value we are getting at $30K, but fully expect to spend a bit of time here. Challenging macroeconomic factors (which we’ll explore deeper in future posts), in conjunction with less than optimal on chain data, leave us to conclude that we will trade flat in coming weeks.
1Inch (1INCH/USDT)
Synopsis 06/14/21:
Market Cap: $633 Million.
Circulating Supply: 172 Million 1INCH.
Max Supply: --
Total Supply 1.5 Billion
SCREEN: % INCREASE IN DAILY VOLUME
1INCH is a DEX (decentralized exchange) aggregator, sourcing liquidity across the Ethereum, Polygon, and Binance Smart Chain protocols. 1Inch works to aggregate the best rates and liquidity across multiple platforms, eliminating the need for users to manually search for those aforementioned items.

Technical Look:
· 1Inch popped up on a relatively simple screen I ran looking for coins/tokens showing unusually high volume relative to their average
· In short, 1Inch was 1 of 2 coins whose trading volume was 50% higher than its moving average over the most recent 30 trading days. Specifically, 1 INCH’s trading volume in Monday’s action was 29 million, in comparison to a 30 day average of 13 million.
· Prices breached the 10 day EMA (exponential moving average) of $3.24, but the 10D EMA remains below the 100D EMA of $4.05.
· The 10 period RSI (which I use as a proxy for momentum) is moving in conjunction with price, which I view as bullish.
· Looking at volume at price, shows what I consider to be mode of value at $4.94, which sits 22% north of the aforementioned 100D EMA.
· Using Anchored Weighted Volume Average Price (AVWAP), and anchoring from 1/1/2021, shows an average price of $3.99 for investors who went long 1INCH so far this year.
· There are a couple of ways to interpret this in my view. First, you have a host of 1INCH holders within distance of being made whole…which could potentially provide resistance should they liquidate at breakeven.
· The 2nd interpretation is that if 1INCH holders are prone to HODL, it should provide a base of support, if price breach $3.99.
· My entry on this trade were I to go long, would be to set a buy stop at $4.05, with a price target of $4.94 (essentially targeting the previously mentioned mode of value).
· In terms of risk management, my stop would be placed at $3.65 (equating to an approximate 10% loss, and the $0.40 loss threshold equivalent to 75% of the current ATR of $0.537)
BACKTEST 09/07/20:
Below is the raw performance/backtest data for a mean reversion trading system I’ve been taking a look at. Full disclosure that this is a backtest, and not currently being run live. In candor, a much larger sample size would likely be appropriate, but as it stands I was looking to test 2020 year to date performance. In straightforward terms, the “idea” behind the strategy is to get (long) exposure to a basket of coins when they they are “cheap”, and exit when said coin(s) approach a historically “average” valuation. I made use of Bollinger Bands, with the 3rd standard deviation and middle Bollinger Band serving as entry and exit points, along with the 14 period RSI (with coins only being considered if the RSI was above 20) . Highlights of the backtest are:
1176 total trades across 23 coins (with BTC being used as the quote currency)
Time period range 01/01/2020 – 09/06/2020
Cumulative profit of 45.27%. Please do not view this (or any isolated performance figure) as endorsement of the strategy as a whole
711 profitable trades, 465 losing trades
Average duration of 14 hours and 10 minutes per trade
Highest performers XVG and ZEC (brief synopsis below)
Poorest performers WTC and KMD

Zcash (ZEC/USD)
Synopsis 09/07/20:
Market Cap: $592 Million.
Circulating Supply: 9.98 Million ZEC.
Max Supply: 21 Million ZEC
Formerly knows as ‘Zerocash, Zcash is a “privacy coin” that aims to be an extension of Bitcoin, but with stronger privacy features. The coin as discussed in its whitepaper allows transactions to be validated without disclosing information about the amount or the parties involved in said transaction. The authentication process for Zcash involves a “zero-knowledge” proof (referred to as zk-Snarks) that verifies that coins are valid and maintained on the blockchain

Technical Look:
· Prices have increased 31% since the 10 period EMA crossed the 100 period EMA (4/22/20)
· Currently there’s been a noticeable uptick in volatility, in conjunction with slowing momentum (using the 14 period RSI as a measurement of momentum)
· Additionally, the 25% decline in prices on 9/3/20 came in conjunction with a spike in volume
· In the 4 subsequent trading days, 3 finished higher on the day, but with average to below average volume.
· In my view, volume at price is indicating an increase in activity at the $52 mark (blue line), implying that we are nearing an area of “agreement” so to speak for Zcash prices.
· Prices are currently near the lower end of its Bollinger Band.
· If viewing this on a purely one off, discretionary basis, I would say that there is very little harmony so to speak as it relates to price action and/or indicators. The bearish case is driven by factors specific to slowing momentum, increased volume on the recent downturn, and weaker volume on the most recent candles higher. The bullish case would be anchored in large measure by Zcash’s proximity to its Bollinger Bands.
· Given the system however, should prices decline to the 3rd standard deviation of its Bollinger Band, we would once again be long Zcash (considering that the RSI metric is also currently north of 20).
ChainLink (LINK/USD)
Synopsis 08/16/20:
Market Cap: $5.9 Billion.
Circulating Supply: 350 Million LINK.
Max Supply: 1 Billion LINK
Decentralized oracle network. As per the Chainlink whitepaper, Chainlink’s aim is to bridge on-chain and off-chain environments. They aim to make smart contracts “externally aware” thus allowing them to access off-chain data securely. As it stands, blockchains are unable to independently access data outside of their network, but require data from sources outside of said network to accurately execute smart contracts. Currently an “oracle” is required to accomplish this. By implementing a decentralized oracle network, Chainlink aims to create a market based system for accessing this external data, theoretically improving the quality and lending additional confidence to the accuracy of the data required for respective smart contracts.

Technical Look:
· Prices have been in an uptrend since April of 2020, following a 46% decline on March 12, 2020.
· 10 period EMA crossed the 100D EMA have since increased to current levels above $19.
· Momentum (using the 10 period RSI as a proxy) is confirming recent price action.
· Conventional wisdom would imply that the RSI level is indicating overbought conditions, though I'm inclined to use RSI as a tool for locating divergences.
· As such, I would not be inclined to exit long positions of LINK based on the RSI level.
· The 2 most recent candles indicate uncertainty in my view, given the narrow trading range. Particularly when juxtaposed with the recent expansion in Average True Range (currently sitting at 1.741).
· Prices reaching the upper level of its Bollinger bands indicates that a reversion to the mean could be in order